Power and Energy Meter
Each eGauge unit combines an energy meter, data logger, and a web server. This powerful combination lets you measure, store and retrieve data directly from the device or from a remote location. Not only does it calculate power (V, A, VAr, kWh, etc), but also data from optional sensors that assess flow rate, temperature, wind speed, and more. You can view historical and live data for up to 30 years with the unit’s convenient user interface (UI). The UI can be accessed on a local network or via the internet from a computer, tablet, or smartphone. Once connected, you have access to real-time values, long-term reports, an interactive graphical interface, and many other tools. The best part is that you pay nothing for the user interface because you retrieve data directly from your own eGauge hardware, not a cloud or 3rd party host.
Compatible Electrical Services
eGauges operate as single-phase or three-phase energy meters depending on their configuration. You can calculate power for any combination of the voltages and amperages listed below. Click here to browse our meter portfolio!
AC Voltage
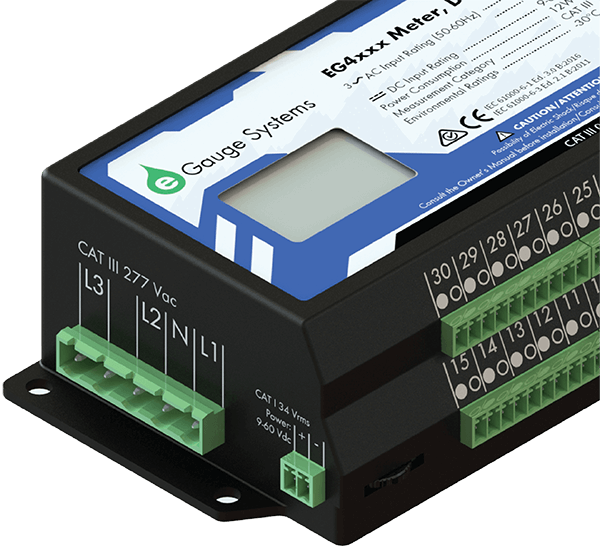
- Single-Phase (1p/2w) 120, 208, and 240VAC
- Split-Phase (2p/3w) 120/240VAC
- 3-Phase (3p/4w) 120/208, 277/480VAC
DC Voltage
- Single source of +/-60VDC
- The meter can be powered with 9-60VDC
Amperage
- 15 or 30 current transformer (CT) inputs
- 5A-6900A per channel
- DC CTs are required for DC power monitoring!
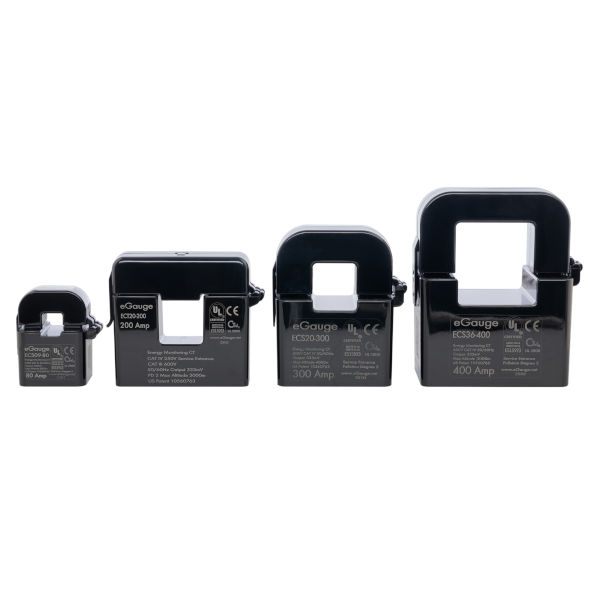
CTs and Rogowski Coils
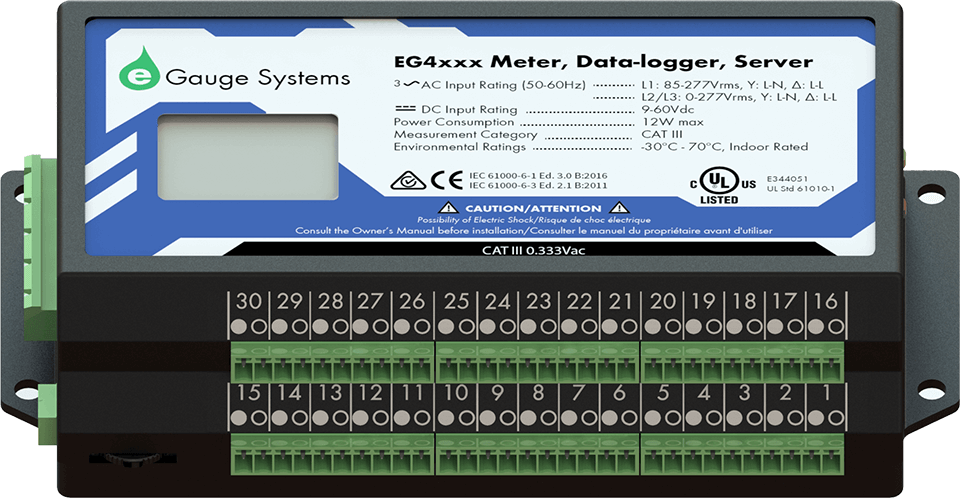
eGauge primarily functions as a current transformer (CT) meter. The Pro model accepts 30 CTs, and the Core model receives 15. The CT input channels read +/-0.5 Vdc, are compatible with most 0.333v CTs, and isolated from digital and high voltage components.
CT Options
Data Protocols and Networking
We've added compatibility for many protocols which allow users to input or output energy data directly to-and-form other systems. Some typical applications include exporting peak kW data to CSV, importing Modbus weather data to compare alongside energy, and integrating with automation systems that use BACnet TCP or RTU.
Supported Data Protocols
- Export: Modbus RTU, Modbus TCP, BACnet MS/TP, BACnet/IP, XML, JSON
- Import: Modbus RTU, Modbus TCP
You can find details about supported protocols here!
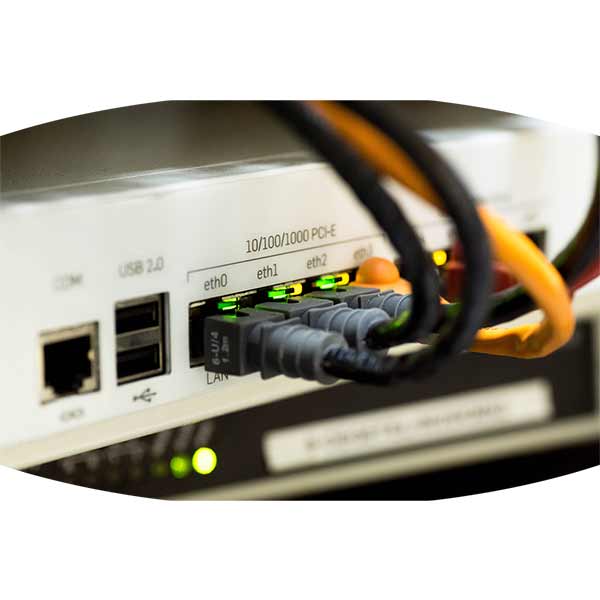
Networking Options
- Built-in: Ethernet, 2.4 GHz WiFi
- Accessory: Cellular
Graphical Monitoring Tools
The eGauge UI brings the powerful combination of an energy meter, data logger, and web server to your web browser. This unique combination allows users to access data by connecting directly to a device from a web browser on the local area network, or from an off site location via proxy server. Any of these connection options provide the same interface, complete with a strong feature set. Our developers work to constantly to improve the available functionality and tools, and upgrading an eGauge Pro to utilize these new features does not cost any extra. One tool that users find particularly useful is the interactive graph because you can combine and compare multiple data points, or adjust the view to focus on a specific area of interest. In addition to the graph, a user has access to monthly summaries, alerts, and more. Overall, the UI makes it possible to isolate, analyze, and understand raw data from the eGauge Pro. In essence, the UI converts data into useful information.
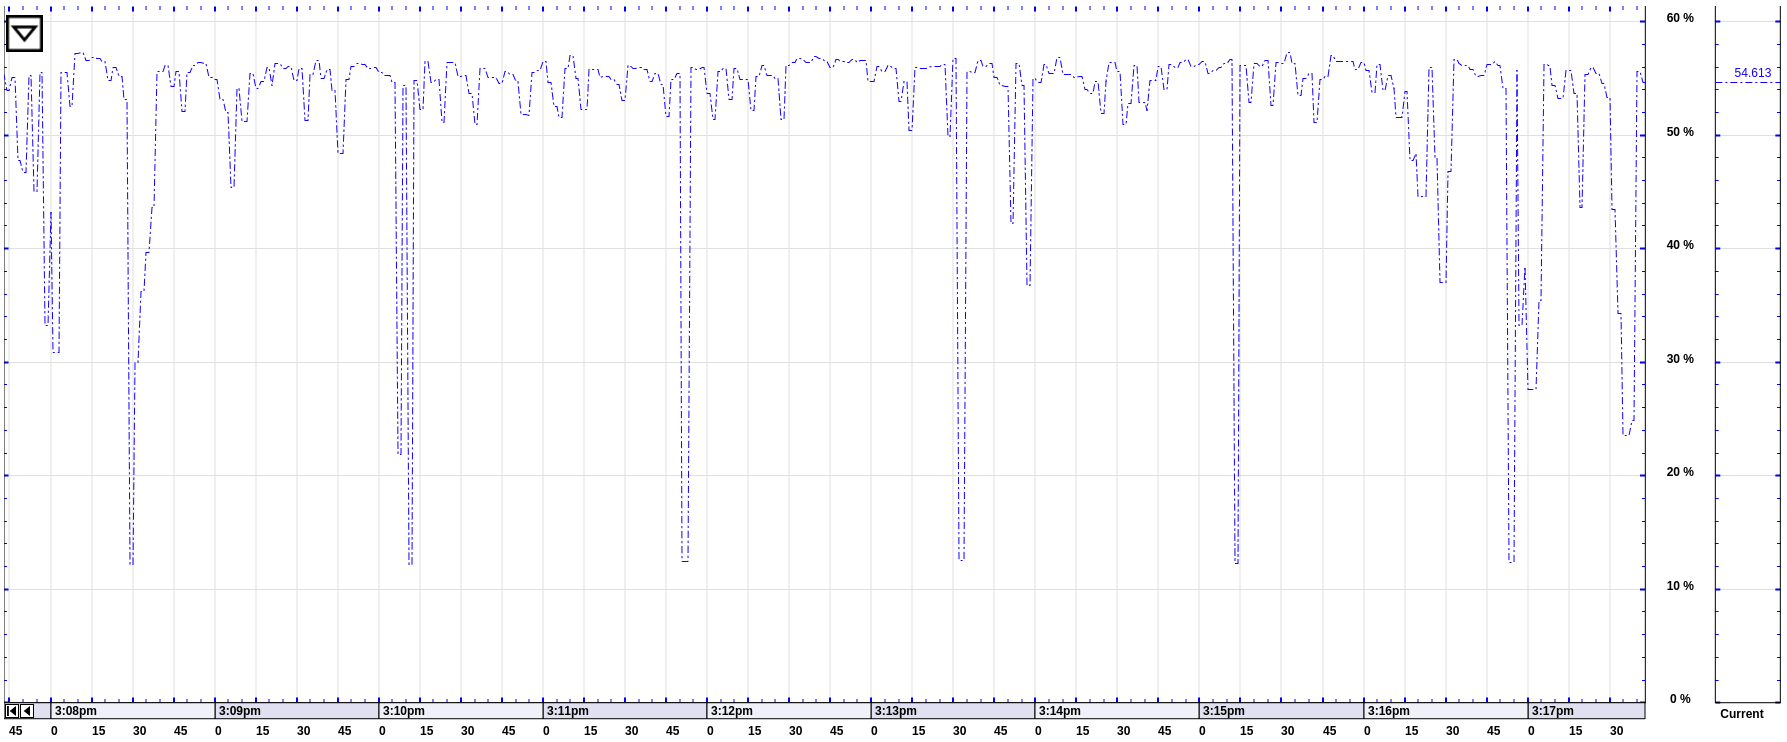
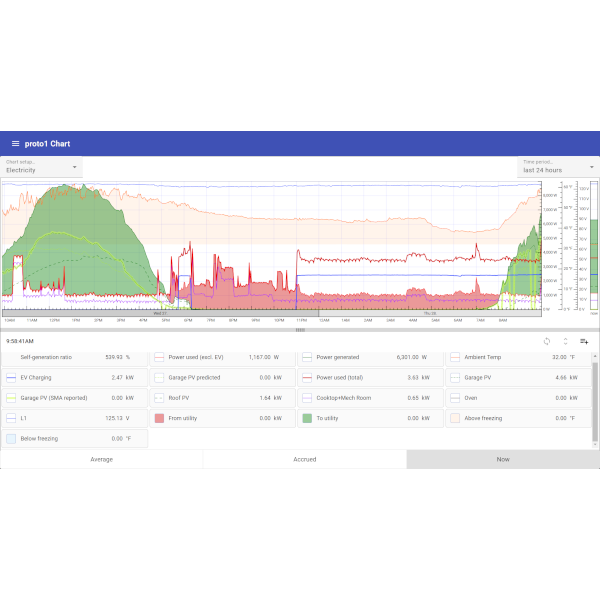
Live Action Graph
The most accurate data in the world isn't much use if it's poorly presented. The eGauge UI presents a powerful and straightforward graph to visualize energy data. The graph is highly customizable and can be set to display (or hide) any number of monitoring points. The monitoring points are shown with user defined time periods so it's easy to analyze data ranging from minutes to months, or even years. Users can create custom views which present data that is formatted for a particular need and removes irrelevant information. The graph is a staple of the UI because it can present highly granular data in an understandable way.
- Free Lifetime Upgrades
- No Subscription Fees
- No Software to Download
- Local Network Access
Real-time Data
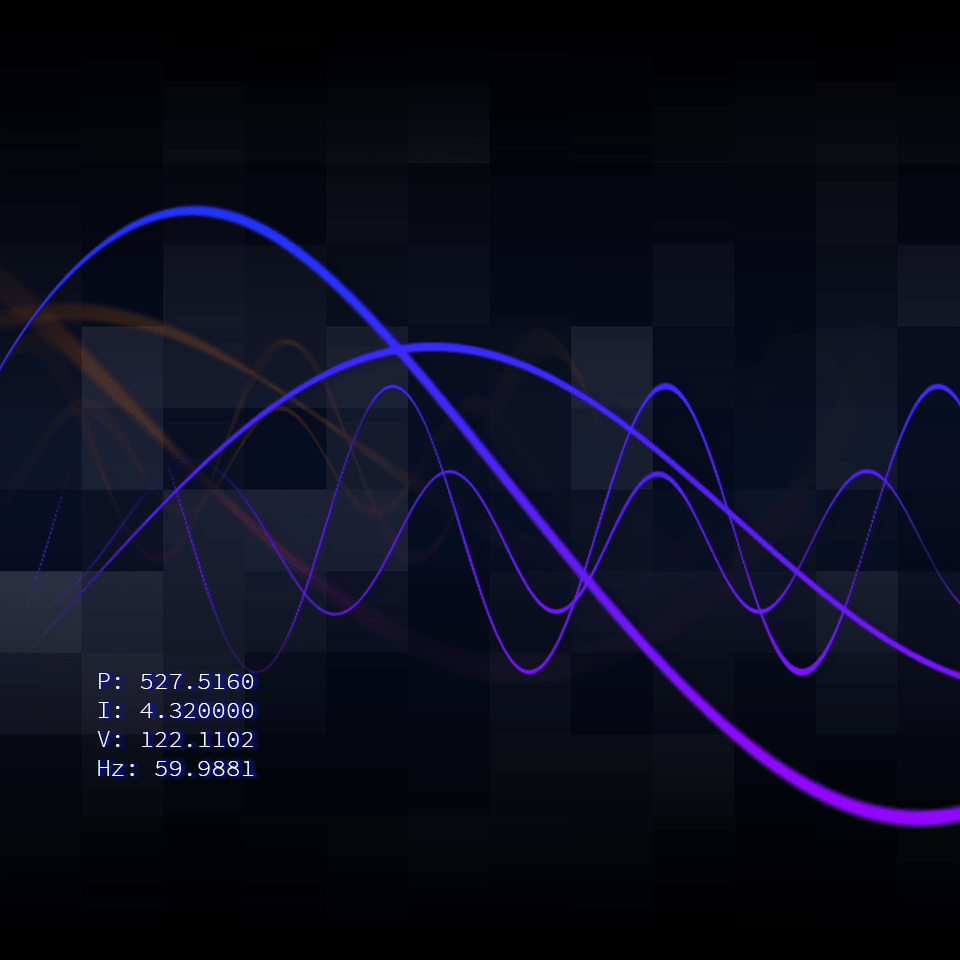
Most metering solutions are beginning to provide users with data in real-time. At eGauge, we’ve been providing this feature since 2008. Not only is the eGauge Pro ahead of the curve, it’s leading the industry with second by second graphical updates. This feature is so precise it lets you see the result of powering a single LED light bulb as soon as you flip the switch. For advanced users, tackling voltage imbalances and harmonic distortion requires second by second speed. The eGauge Pro eliminates the need to review highly granular power data at a later time, and allows users to view the information as changes are taking place.
JSON API
As energy costs increase, there are more and more ways to measure and analyze energy data. For example, integrating weather data can help better understand air conditioning habits (a huge contributor to energy costs). In our effort to provide every tool possible we offer third party developers access to our JSON API at no cost. By doing so, we hope to expand the energy data toolset available to eGauge customers.
Spreadsheet Export
Energy enthusiasts often want to use data in new and interesting ways. To help promote this innovation we include the ability to export CSV formatted spreadsheets, which are widely supported by operating systems and spreadsheet programs. We’ve seen exports used for bill generation, energy reports, or even fed into a secondary database where the data was used to quickly perform advanced data calculations. CSV exports are perfect for users looking to take full advantage of fine granularity eGauge data.
Alerts
Energy utilization is more complicated than ever, and energy professionals work hard to prevent loss from unexpected failures. For example, commercial equipment, such as refrigeration, needs to be monitored at all times because collapse of that system can mean loss of capital and unhappy stakeholders. However, tools like the eGauge Pro can help energy professionals prevent these losses by monitoring for unexpected activity and sending alerts via text message and email. This way, professionals can expand their services instead of babysitting troublesome equipment.
Advanced Analytics
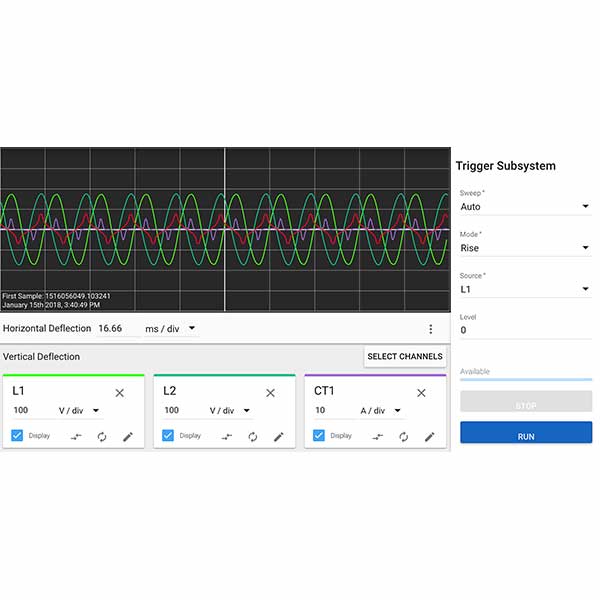
The oscilloscope tool in the user interface offers expert users an opportunity to research aspects of power quality, like power factor, phase offsets, polarity, and more. You'll have full control of sweep, mode, source, and level to dive into some reasonably advanced analytics.
Questions about the User Interface?
Our sales team is here to help!
Phone: 1-877-342-8431 x1
Submetering
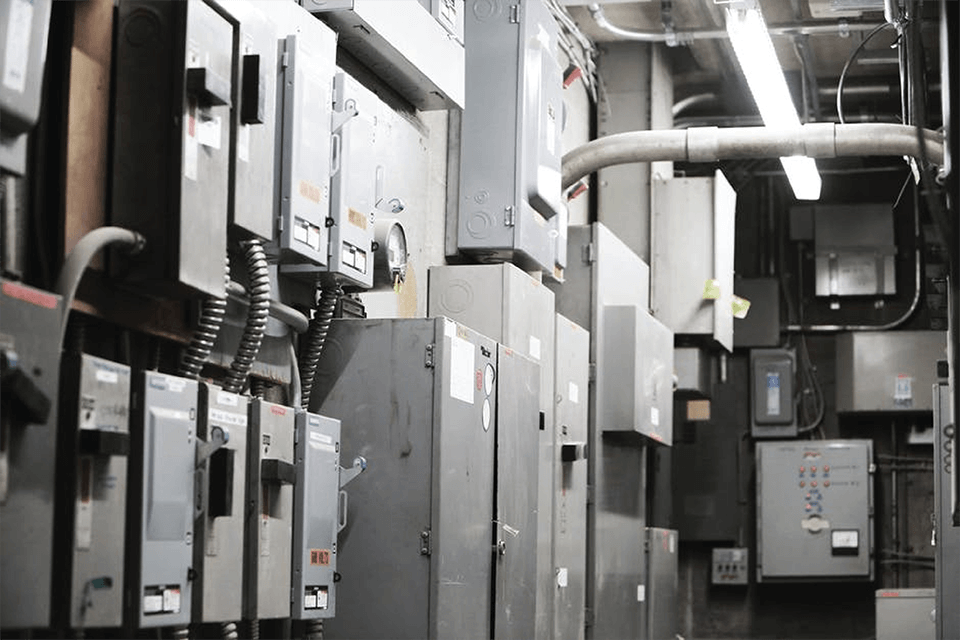
eGauge Pro is equipped with 30 CT inputs, so a single unit can effectively replace 10-15 traditional submeters. Not only will this drastically lower equipment and installation costs, but it will also reduce maintenance. The eGauge Pro is proof that traditional submetering hardware has become obsolete. Where old meters lack features, eGauge Pro sports an immense 30 year local storage capacity, the ability to record data on 64 different energy sources, and ample data communication options including cellular, WiFi, and Bluetooth. In addition to an array of modern hardware features, the system includes a subscription free user interface (UI). The UI displays submetered loads individually or in aggregate, which makes it easy to gather localized or site-wise energy data. This information is available as a spreadsheet export for use in other software programs such as Microsoft Excel and Google Sheets.. And, if you want to go beyond a spreadsheet and send data to your billing service, check out our open JSON API. Together, the hardware and software features of the eGauge Pro make it a dominant contender in the submetering market, where traditional meters are starting to gather dust.
Common Analysis Applications
- Educational Institutions
- Municipalities
- Multifamily Housing
- Quick Serve Restaurant Industry & Franchises
- Lights/Loads/HVAC Reporting
Have another application?
Contact our Sales team
to find out if eGauge fits your requirements.
Multi-tenant Buildings
Submetering multi-tenant buildings can provide property owners and tenants a means of reducing costs by improving their energy efficiency. It can bring equality to tenants being billed from their square footage or number of occupants because the energy consumption of each tenant may still be drastically different. By allocating energy costs accurately, you can improve tenant satisfaction, reduce turnover, and encourage lower energy consumption from those tenants using more than their fair share.
Property Management
Managing properties with traditional submeters can be a slow process. With the development of internet connected meters, such as the eGauge Pro, property managers no longer need to retrieve energy information by walking up to a meter and recording values. Now, they can simply open a web browser from their office and download that information. This method simplifies managing multiple buildings or distant locations. Managers can also configure eGauge Pro to keep an eye on problem equipment. Elevators and HVAC equipment, for example, can be setup with automatic alerts when a failure occurs, speeding up repairs and keeping tenants happy.

Checkout the Products Page For Pricing, Specs and More!
Facility Metrics,
Benchmarking and Alerts
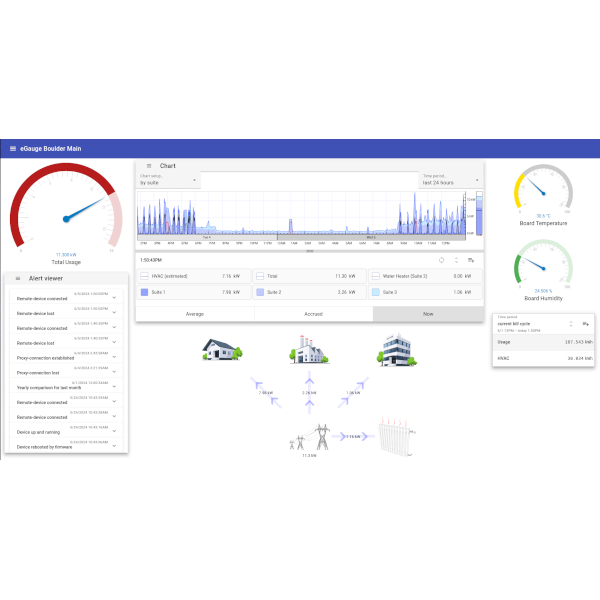
There are a variety of factors which influence electrical costs for large facilities. Traditional utility meters don't track these factors, which means site managers have no way to determine how equipment is performing or where sudden usage spikes are occurring. The eGauge Pro puts these metrics at the site manager's fingertips. It allows users to track individual loads, power quality, peak demand, and other factors of interest. In addition, the eGauge can be configured to send SMS and email alerts when certain conditions are met. This feature helps prevent capital loss due to overloaded equipment or excessive peak demand. Take back control of your facility with the eGauge Pro.

Site-wide Analysis
With rising electricity costs and increasingly sensitive electronic hardware, a building manager needs to know more than just monthly kWh values. Peak demand charges add hundreds of dollars to utility bills, and identifying which area of a facility contributes to this charge is difficult. The eGauge Pro can be used to pinpointing liable equipment and determine when and where peak demand charges occur. Facility managers then have the information needed to modify load profiles and limit peak demand. In addition, the eGauge Pro user interface makes it easy to compare similar loads and provide warning of impending hardware failure so building managers can intervene and address issues before they cause serious damage.

Equipment Verification
Monitoring the status of equipment in a facility can be a daunting task. To make large monitoring jobs more attainable, the eGauge Pro supports up to 30 CTs, so a single meter can measure numerous loads and even generation sources (solar PV, gas generators, etc...) simultaneously. Then, it measures and records useful power metrics, including power factor and total harmonic distortion. This data can be used to verify equipment health and identify potential problems before they become an issue. And with all the data available through a single interface, building managers save time and avoid errors when analyzing data.
Building Automation
BACnet IP
Many facilities have building automation and control systems that can amplify the benefits of energy metering. However, this means that new or replacement metering hardware must integrate seamlessly with the existing system. eGauge Pro supports data export via BACnet IP, one of the most common building automation and control protocols available. BACnet support is included at no additional cost, and with BACnet output readily available, the eGauge Pro can be effortlessly integrated into automation and control systems as part of a new installation or a retrofit upgrade.
JSON API
It is difficult for a single software interface can cover the needs of every user. For example, line graphs are not ideally suited for displaying cumulative data, since the line would forever increase upward. One problem with presenting data is that many energy meters provide a single interface and don't grant access to the data recorded by their hardware. Unlike these offerings, the eGauge does not tie the user to a single interface, and access to an open JSON API is provided with every device. Using the JSON API, a developer can create a user interface that meets the requirements of the any user, however basic or complex they may be.
Specific Job Requirements?
Ask Our Technical Sales Staff
Phone: 1-877-342-8431 x1
Email: sales@egauge.net
Renewable Energy

The addition of renewable energy sources can give customers a new avenue for making profits. However, the financial benefits can be put at risk if the investment is not continuously monitored for performance. Monitoring system performance in real time can ensure that PV and wind systems are operating with maximum returns. eGauge Pro tracks these returns with revenue grade accuracy and can also be configured to record SRECs. In addition to renewable energy systems, these high accuracy measurements can be used to analyze energy consumption. With energy consumption data, eGauge Pro acts as a tool to help modify load profiles to maximize net energy generation. Given these benefits, eGauge Pro can complement your investment by preventing unexpected loss of production and improve all around energy utilization.
Common Renewable Applications
- Automatic Alerts
- Inverter Measurement
- Strings
- Batteries

Automatic Alerts
Energy utilization is more complicated than ever, and energy professionals work hard to prevent loss from unexpected failures. For example, renewable energy stakeholders want assurance that their investment is providing returns, and unexpected downtime needs to be addressed without delay. Using a tool like the eGauge Pro can help energy professionals prevent these losses by monitoring for unexpected activity and sending alerts via text message and email. This way, professionals can expand their services instead of babysitting troublesome equipment.
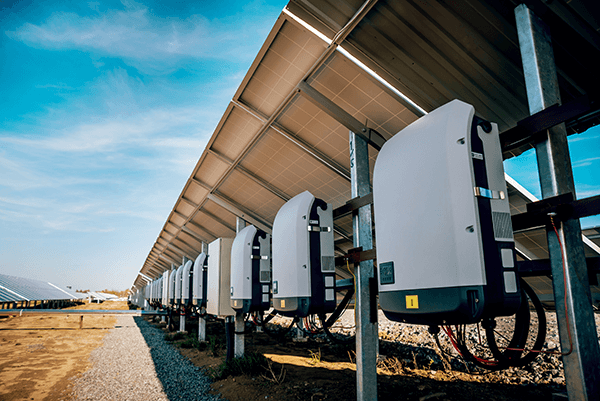
Inverter Measurements
Each inverter brand seems to have its own set of monitoring and communication protocols and managing multiple brands without the help of expensive monitoring software can become tiresome. Installers now have an option to use one monitoring solution that works with all inverters. In addition to reducing complexity, the eGauge Pro gives installers a tool for self-promotion because their company logo is placed on the User Interface of each device they purchase. Now, when potential customers see your monitoring, they’ll see your brand rather than the inverter’s brand.
SRECs
Solar Renewable Energy Credits (SRECs) are a direct source of income for investors in solar PV. Underreporting SRECs means leaving money on the table, and reporting SRECs incorrectly can have consequences as well. Therefore, taking precise and accurate measurements is critical for achieving a prompt return on solar PV investments. The eGauge Pro measures with revenue grade accuracy and allows users to aggregate multiple production sources into one place. The eGauge is also flexible; it can track individual inverters or whole groups and notify the user if systems are performing inadequately. With these measurement, you can obtain SREC data for export to your preferred broker or state office.
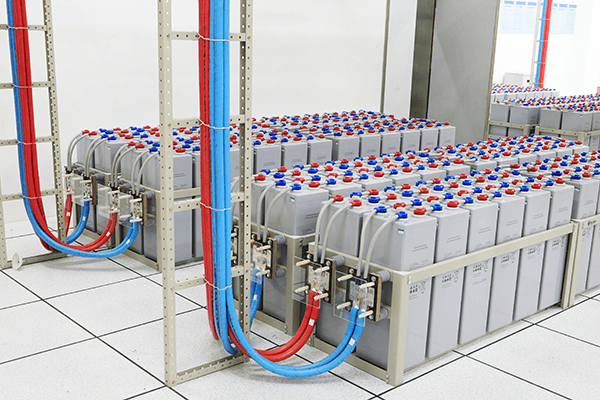
Battery Storage Systems
Batteries are gaining ground in commercial buildings and facilities for their ability to reduce peak demand power. Batteries can reduce peak demand by simply charging from the utility, but they can reduce overall energy costs even further when paired with a renewable energy system. However, batteries are expensive and it’s important that battery storage is not oversized. eGauge Pro can be used to measure a location’s energy profile before investing in batteries to ensure that battery storage systems are sized correctly.
eGuard
Large scale monitoring platforms have historically been very expensive and cost prohibitive for many renewable energy professionals. The high cost is due to companies operating with a software as a service (SaaS) model that charges customers recurring monthly or yearly fees. Unlike the SaaS model, the eGauge Pro was designed to store data locally rather than in the cloud, reducing our data storage costs. To pass on these savings we developed a large scale monitoring platform called eGuard. The eGuard platform contains many of the same features as pricey monitoring solutions but is a free tool for eGauge users. We’ve detailed eGuard and its features for you here.
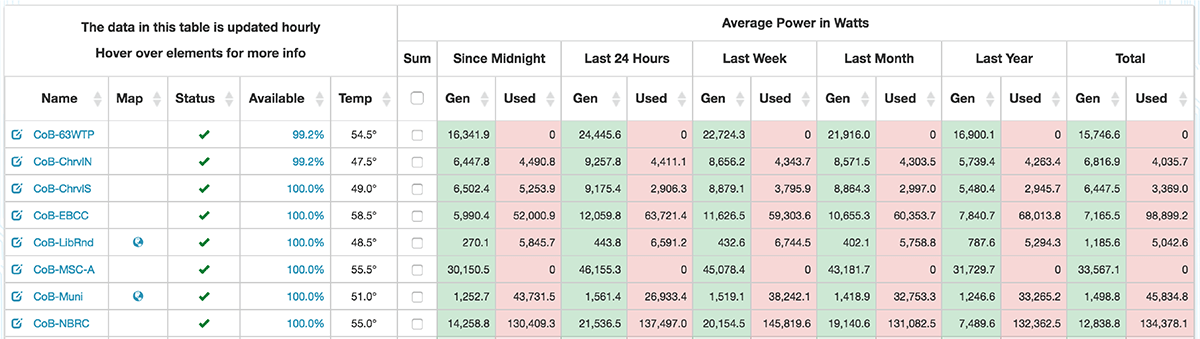
The eGuard Portfolio showing energy consumption in red and solar production in green. The table can be organized by any of the table headings, such as site name, production or consumption value, or even device temperature. The eGuard Portfolio is designed for site administrators who want to see a summary of many devices from one convenient place.
Ready to Protect Your Renewable Investments?
Our Sales Team Can Build the Right Package for You!
Phone: 1-877-342-8431 x1
Power Analysis
Power analysis meters have historically been very expensive and cost prohibitive for many energy professionals. However, as electronic components become smaller, cheaper, and even more capable, the cost of power meters is falling. The eGauge Pro takes advantage of these new components and provides power analysis that is affordable and robust. Our highly accurate meter is coupled with a data logger that records one second interval data for up to 30 days, and one minute interval data for a full year. These features make the eGauge Pro a great choice for gathering data on everything from peak demand to power factor and voltage phase imbalances. So, if you have been eager to begin an analysis project, or are looking for a new power meter, then the eGauge Pro is the meter you’ve been looking for.
Common Analysis Applications
- Peak Demand
- Baseload Analysis
- Power Factor
- Harmonics (THD)
Have another application?
Contact our Sales team
to find out if eGauge fits your requirements.
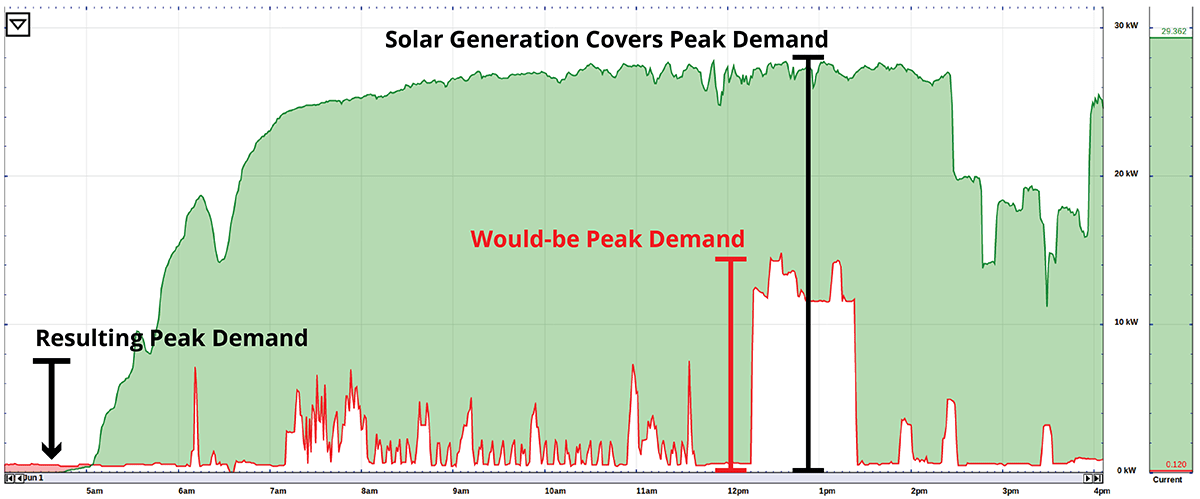
Peak Demand and Baseload Analysis
Utility companies are constantly looking for ways to reduce short term and high consumption commercial power demand. Recently, utilities have implemented peak demand rates to discourage their customers from quickly raising their power draw above an expected baseline load. This method protects the utility from economic loss and supports a healthy grid. However, demand rates can contribute enormously to commercial electricity costs. Luckily, the eGauge Pro is designed to capture a location’s baseline load and peak demand spikes. It is a remarkable tool for energy professionals looking to drastically reduce their client's electrical costs.
Real-time Alerts
Energy utilization is more complicated than ever, and energy professionals work hard to prevent loss from unexpected failures. For example, commercial equipment, such as refrigeration, needs to be monitored at all times because collapse of that system can mean loss of capital and unhappy stakeholders. However, tools like the eGauge Pro can help energy professionals prevent these losses by monitoring for unexpected activity and sending alerts via text message and email. This way, professionals can expand their services instead of babysitting troublesome equipment.
Historical Trend Analysis
Utility bills are the standard method for recording energy savings over time. However, some energy professionals wish to use new technologies to track which of their investments contributed to improvements. Providing this information to stakeholders can inspire confidence and lead to further investments in efficiency measures. Energy information is available on eGauge Pro for the lifetime of the meter, making it ideal for long term energy projects. Best of all, data is stored locally, bypassing the need to rely on our servers for access to your information.
Renewable Energy Impact
eGauge Pro measures electrical generation and consumption loads which makes it well suited to help size renewable energy and battery systems. Often, these systems are used to reduce the peak demand of a commercial facility. It is important to continuously monitor these facilities because electricity demand can change if equipment or business habits change. Missing even one day of change could result in unnecessary costs for the business. eGauge Pro continuously monitors for these changes and prevents loss by sending instantaneous alerts.
Measuring Power Quality
The quality of power can influence the health of equipment and even result in higher electricity costs. Further, if your power quality is low, you may be paying for more electricity than you are able to utilize. Understanding power quality is difficult without a power meter because a standard utility meter does not provide this information. Without access to power factor and harmonic distortion values it’s difficult to know if you have poor power quality, and the costs from this lack of information can add up. The cost of power quality can be tracked with the eGauge Pro so you can be confident that you are not bleeding money to your utility company.
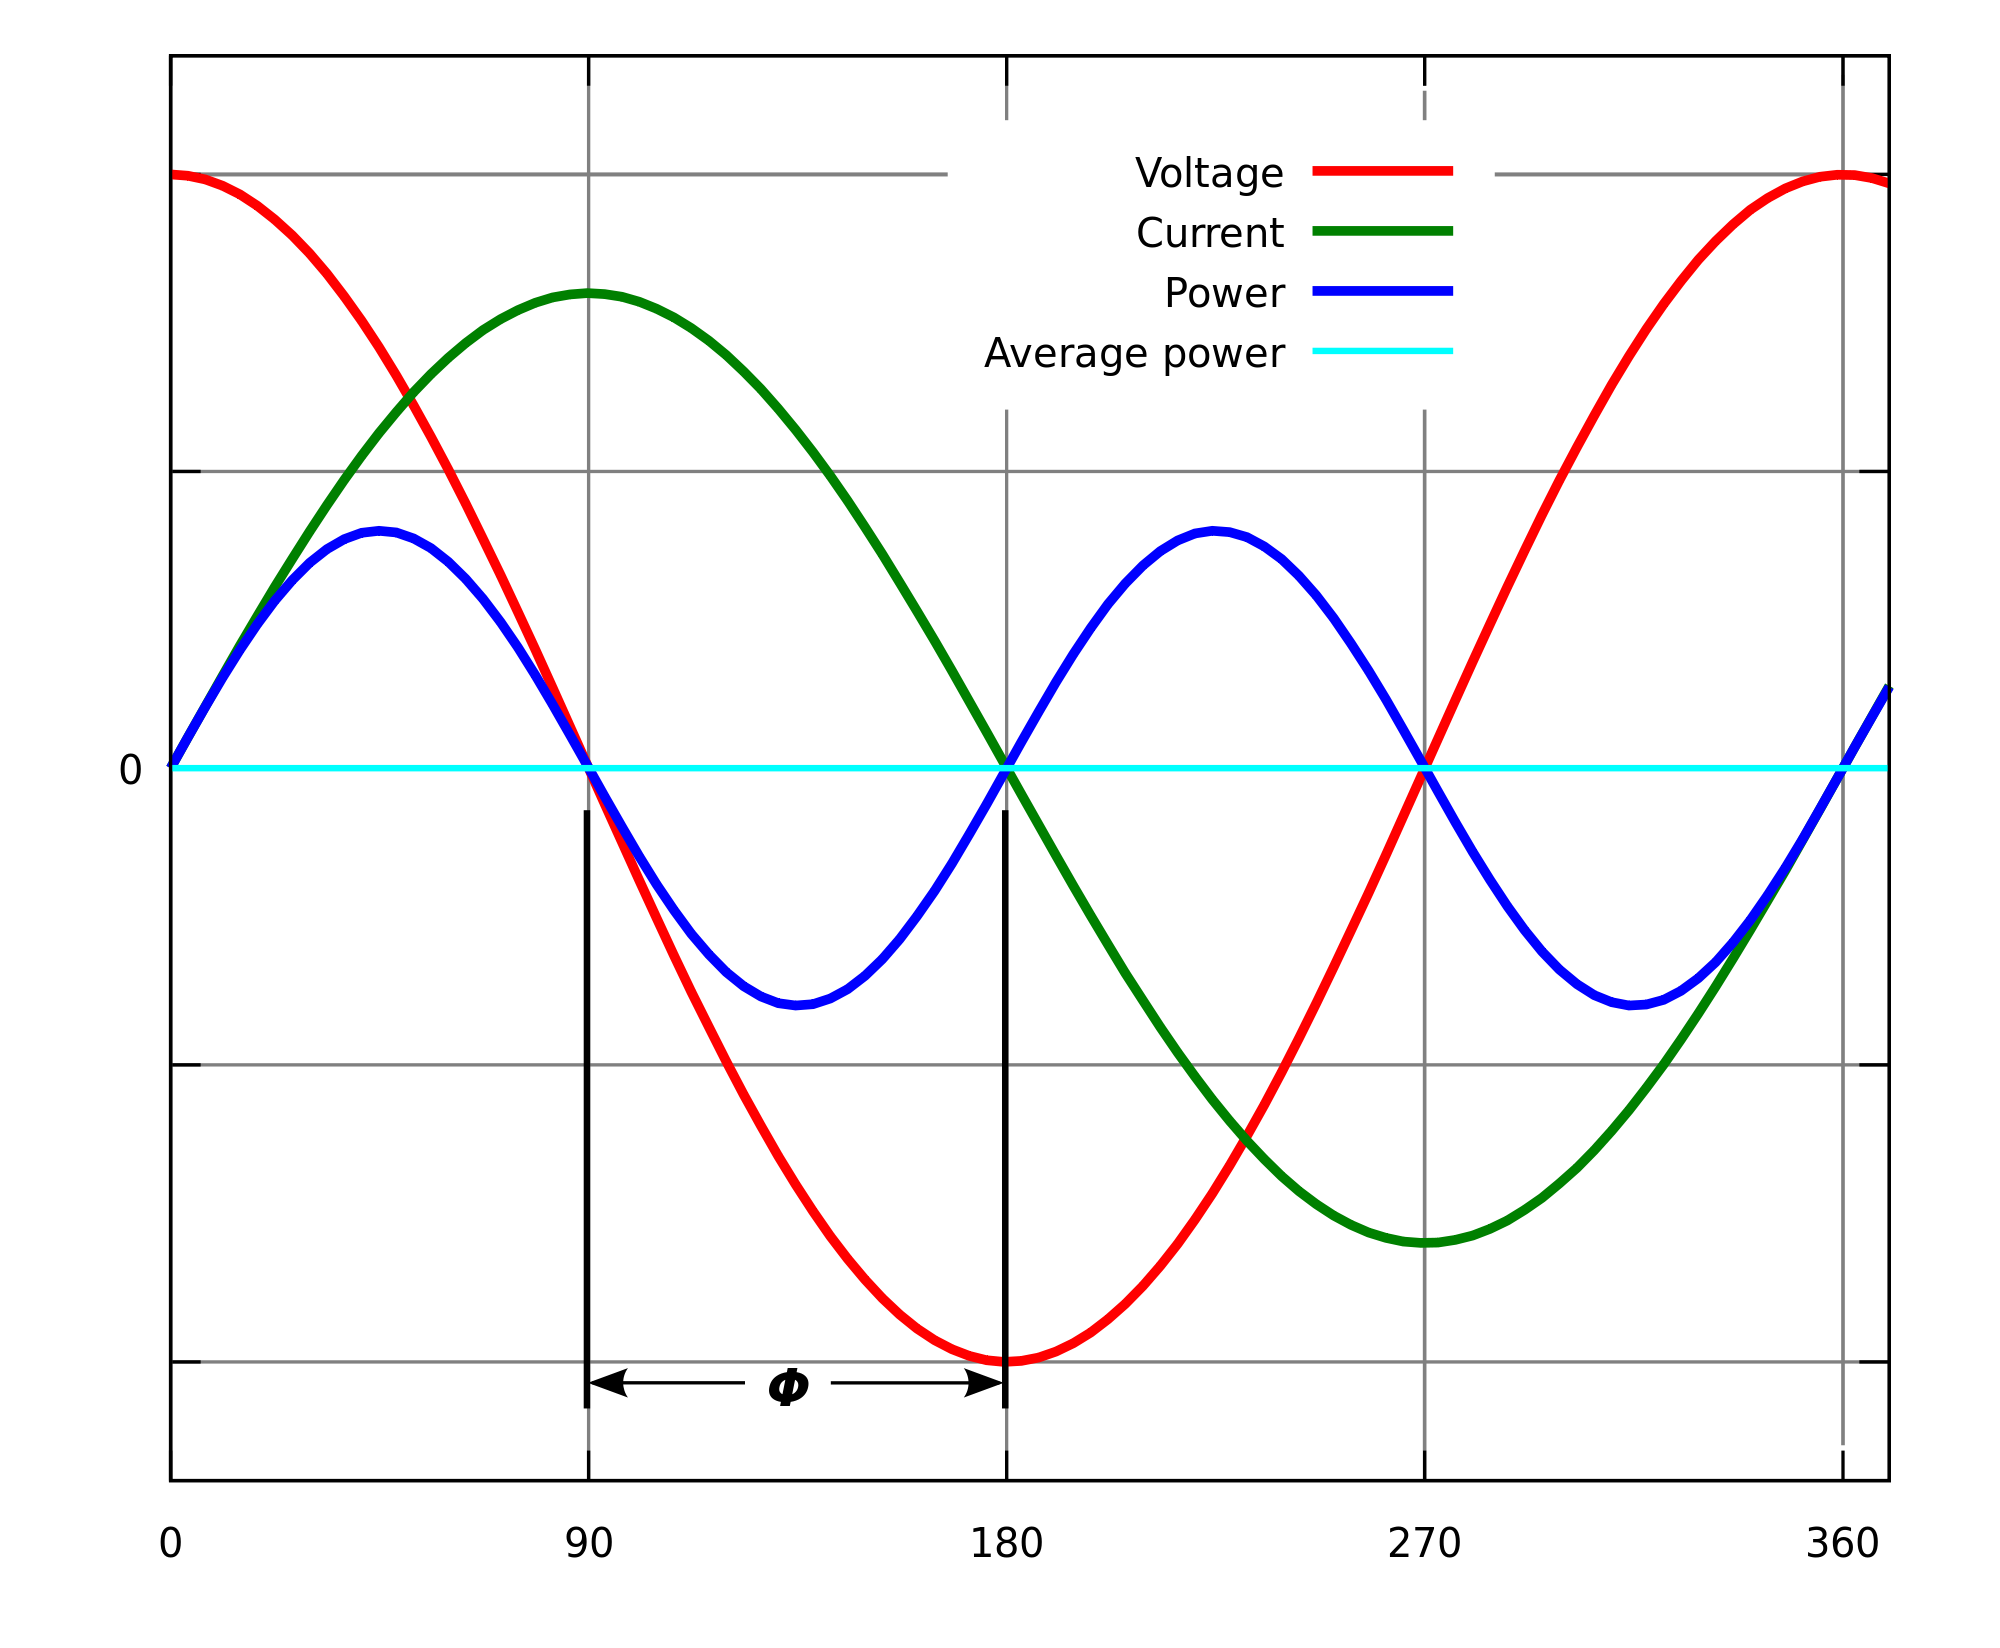
Power Factor
Power factor is the ratio of the real power to the apparent power. This value can range from 0 to 1, with 1 being a perfect power factor. It indicates how efficiently a building or piece of equipment uses power. A low power factor can mean that you are paying for more power than is actually being used by these loads. Circuit level monitoring can identify which loads are contributing to low power factor. eGauge Pro can measure power factor on up to 30 loads at a time which saves large facilities the time of moving a single circuit power meter from place to place. This measurement consolidation speeds up load studies so energy professionals can spend more time making improvements.
Harmonic Distortion (THD)
THD is a measure of waveform distortion on an electrical service in the voltage or current waveform. It is created by switching loads and large inductive loads. This is important in electrical systems, as high THD can cause unnecessary heating on the building wiring. It may also be an important factor in systems where sensitive electronics are present. Extremely high THD can cause electrical devices to overheat and fail over time, especially transformers. Some agencies, such as utilities and the FCC, impose limits on this distortion.