Monitor Electricity on Every Circuit with Precision and Accuracy
Better than a kWh Meter
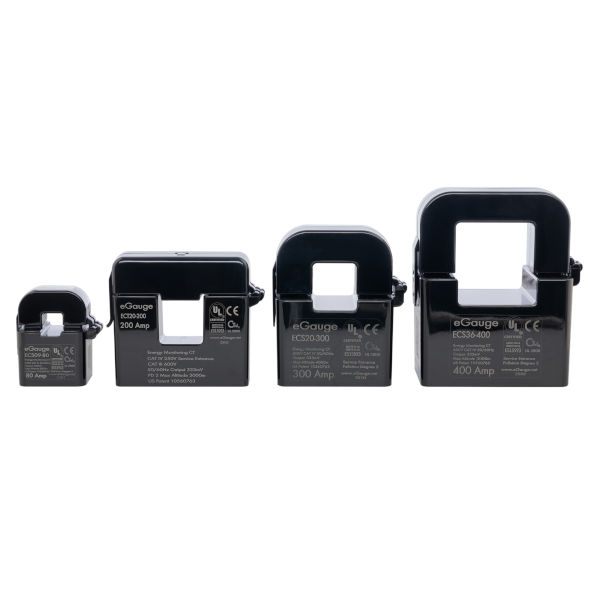
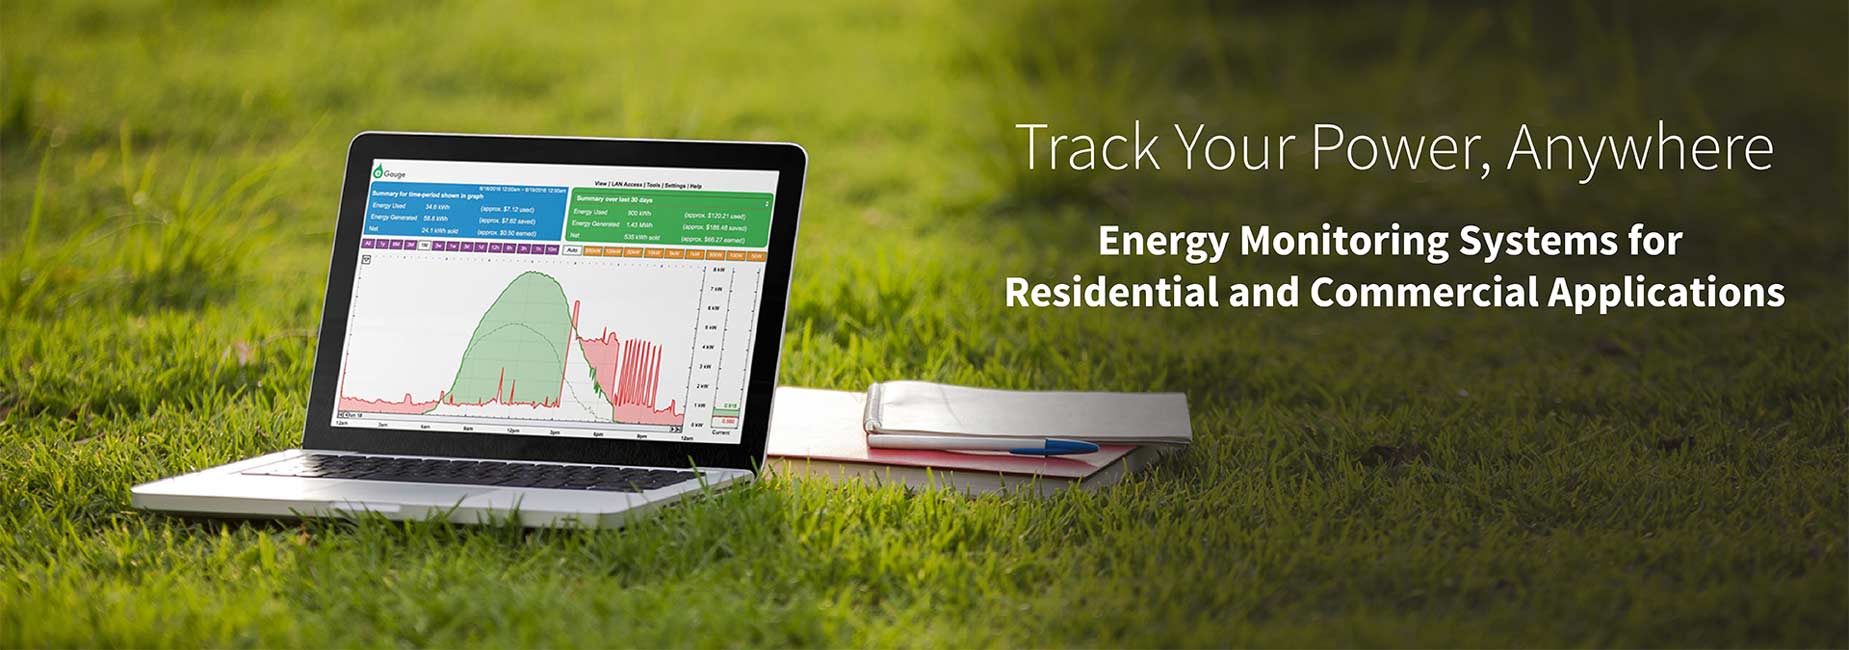
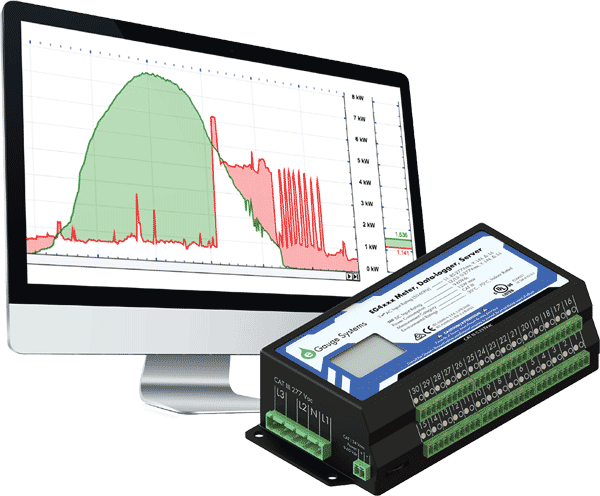
The eGauge is a CT meter, which means it can measure the power of individual circuits in your electric panel using sensors called current transformers (CTs). The meter also displays your energy data on a webpage in real-time. Watch as your graph changes every second, revealing potential problems that you could never discover with a simple utility bill.
Mobile Energy Alerts
Carry on with your daily routine while eGauge watches for unexpected energy patterns. These text and email alerts work for you to find excess equipment usage, unexpected demand charges, loss of renewable energy production and other costly failures. Energy alerts are user-definable and can be set to trigger for virtually any threshold value.
Greater Efficiency Savings
Save more money with your energy efficiency projects with a metering system that has no subscription fees. We want you to take two steps forward and no steps back when it comes to your green investments.
And more...
ANSI C12.20 Revenue Grade Accuracy Compliant | Renewable Energy Measurements Come Standard | Measure AC or DC Power with One Meter | Monitor Hundreds of Meters with the eGuard Portfolio Manager | Connect up to 30 Current Transformers | Meters Have Device Lifetime Data Logger | CSV Exports | Published JSON API
Flexible Networking Options
Network Connection
Ethernet
HomePlug AV (PLC)
Cellular
WiFi
Supported Data Protocols
JSON API
BACnet IP
Modbus TCP/RTU
Looking for Something Else?
Contact Us to find out if your protocol is in development!
The eGauge Hardware
Meter | Data Logger | Server
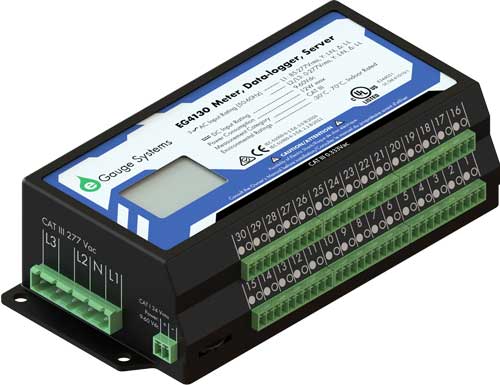
Each eGauge unit combines an energy meter, data logger, and a web server. This powerful combination lets you measure, store and retrieve data directly from the device or from a remote location. Not only does it calculate power (V, A, VAr, kWh, etc), but also data from optional sensors that assess flow rate, temperature, wind speed, and more. You can view historical and live data for up to 30 years with the unit’s convenient user interface (UI). The UI can be accessed on a local network or via the internet from a computer, tablet, or smartphone. Once connected, you have access to real-time values, long-term reports, an interactive graphical interface, and many other tools. The best part is that you pay nothing for the user interface because you retrieve data directly from your own eGauge hardware, not a cloud or 3rd party host.
Featured Specs
- Revenue Grade Accuracy (ANSI C12.20 - 0.5% and C12.1 - 1%)
- 0-277VAC Phase-Neutral
- 0-6900 Max Amperage per Channel
- Up to 30 Channels
- Renewable Energy + Energy Usage
User Interface
Data | Graphics | Alerts
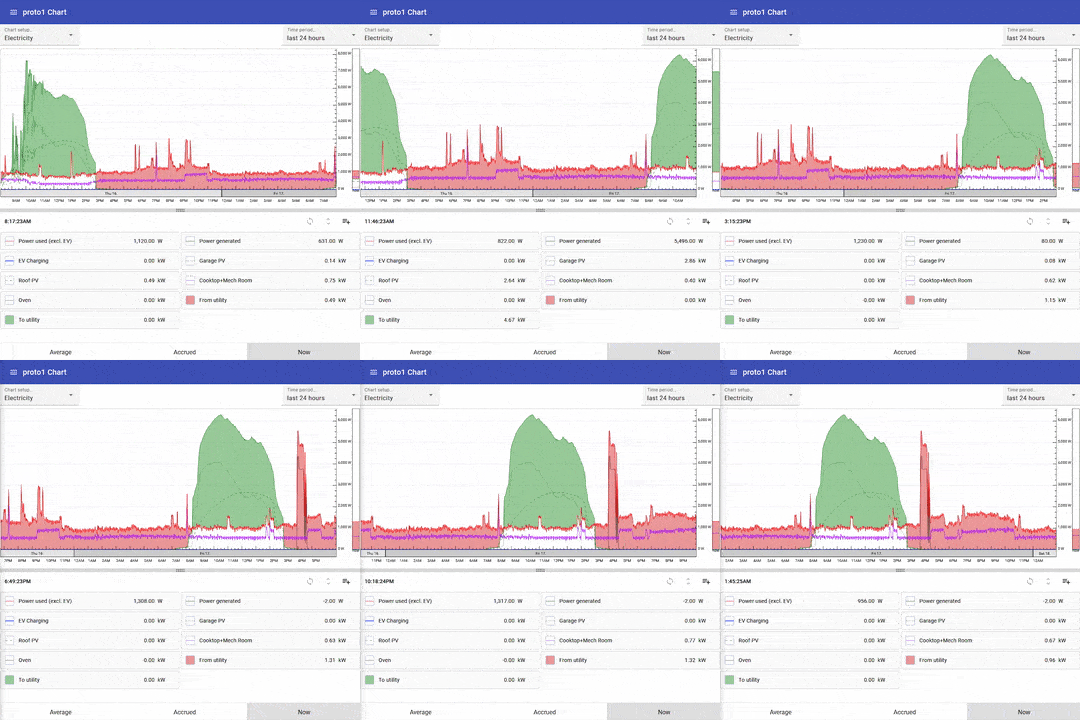
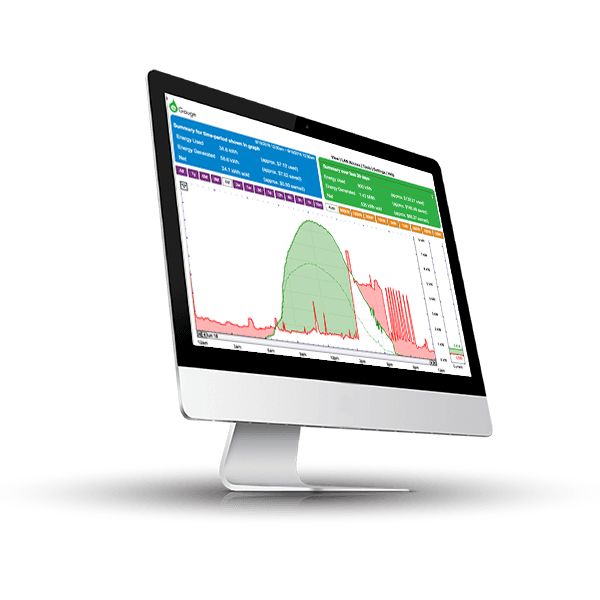
The eGauge UI presents a powerful and straightforward graph to visualize energy data. The graphical view is highly customizable and can be set to display (or hide) any number of monitoring points. The monitoring points are shown with user defined time periods so it's easy to analyze data ranging from minutes to months, or even years. Users can create custom views which present data that is formatted for a particular need and removes irrelevant information. The graph is a staple of the UI because it can present highly granular data in an understandable way.
Featured Specs
- Data Updates Every Second
- Custom Alerts
- CSV Exports
- Energy Production vs Energy Usage
- Daily, Weekly, and Monthly Summaries
